Visualization Trapping Rainwater II - Leetcode 407
I’ve recently been working through some Leetcode problems and arrived at Trapping Rainwater II after completing Trapping Rainwater. By the way I really recommend For-All-Epsilon’s video on that problem. I was able to solve the question, with a hint from one of the first videos and I learnt a new technique from the third video.
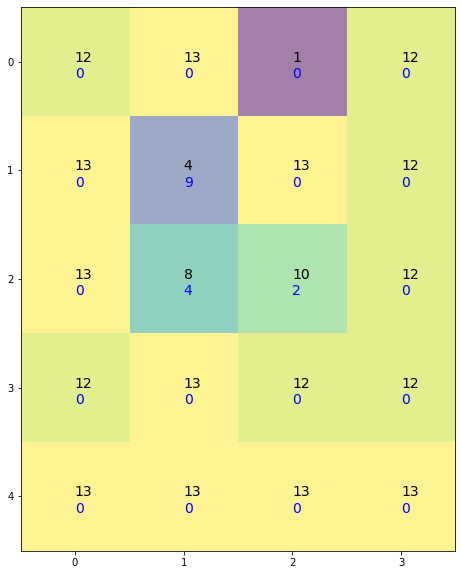
Anyway, I was struggling to figure out why my naive solution wasn’t working so I built a quick visualization using Matpltlib to figure out what was going wrong.
Using a 2D grid with colour map and labels to show the elevation map and the water heights at each index.
Matpltlib 2D Grid With Labels
import numpy as np
import matplotlib.pyplot as plt
from typing import List

# NOTE:
# - Function signature changed from Leetcode:
# `def trapRainWater(hm: List[List[int]]) -> int`  -> `def trapRainWater(hm: List[List[int]]) -> List[List[int]]:`
# - Algorithm for trapping rain is incorrect! The visualization helped me figure out why
def trapRainWater(hm: List[List[int]]) -> List[List[int]]:
    m = len(hm)
    if m < 3:
        return 0
    n = len(hm[0])
    if n < 3:
        return 0

    total = 0
    w = [[0]*n for i in range(m)]
    for i in range(m):
        for j in range(n):
            # min left right
            lm = max(hm[i][:j+1])
            rm = max(hm[i][j:])
            lrm = min(lm, rm)
            # min up down
            dm = hm[i][j]
            um = hm[i][j]
            for k in range(i, m):
                dm = max(dm, hm[k][j])
            for k in reversed(range(0, i+1)):
                um = max(um, hm[k][j])
            w[i][j] = max(0, min(lrm, um, dm) - hm[i][j])
            total += w[i][j]
    # return total
    return w
def plot_2d_grid_with_water(g):
    w = trapRainWater(g)
    fig = plt.figure(figsize=(10,10))
    ax = plt.axes()


    m = len(g)
    n = len(g[0])

    ax.axes.yaxis.set_ticks(range(m))
    ax.axes.xaxis.set_ticks(range(n))

    for i in range(m):
        for j in range(n):
            h = g[i][j]
            label = f"{h}"
            ax.text(j, i, label, fontsize=14)
            ax.text(j, i+0.15, w[i][j], fontsize=14, color='blue')
    plt.imshow(g, alpha=0.5)
    plt.show()

lc = [[12,13,1,12],
[13,4,13,12],
[13,8,10,12],
[12,13,12,12],
[13,13,13,13]]
plot_2d_grid_with_water(lc)
Why not 3D?
Originally I had planned to use a 3D bar plot for visualizing the elevation map as shown in the problem description, but I actually found it was more distracting and less clear than just doing a 2D grid with labels like this.